Knowledge Base
Live Data For Reports Or Import
You can get live data, for ticket sales, revenues, and attendees, that you can use to generate interactive visualization reports using Microsoft’s Power BI or Google’s Looker Studio (Google Data Studio).
The same data can also be imported and viewed directly in Google Sheets or Excel.
To generate the data to use with Power BI or Looker Studio, go to the Data Feed page.
On that page, select an event then choose the report type.
After that, click on the Generate button.
Generating Visualization Reports
Visualization reports are available for ticket sales, revenues earned, and claimed and redeemed offers.
Using Power BI
In the pop-up that then appears, click on the Copy For Microsoft button.
Note – the copied URL should not be shared publicly.
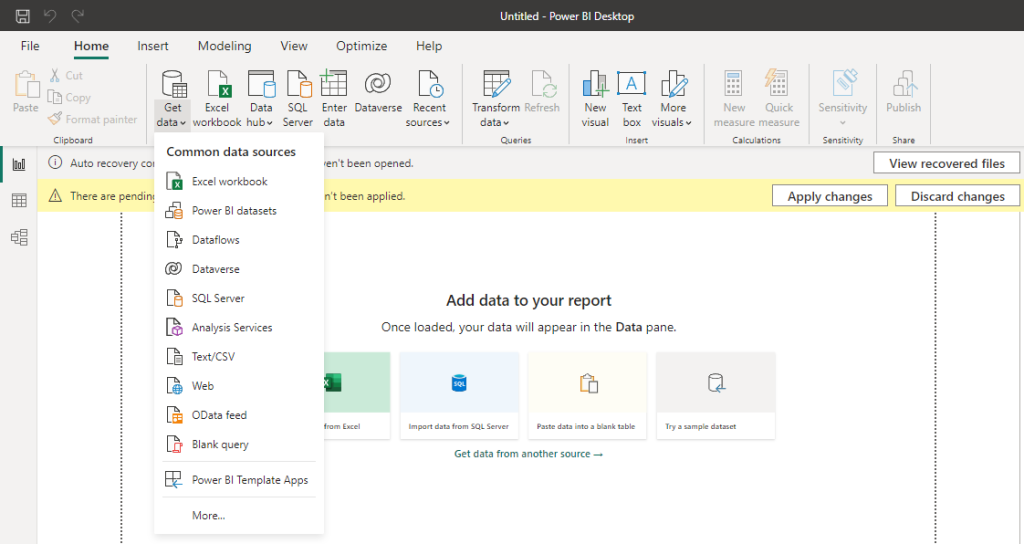
In your Power BI application, go to Get Data > Web.
Next, paste the copied URL in the dialog prompt then click on the OK button.
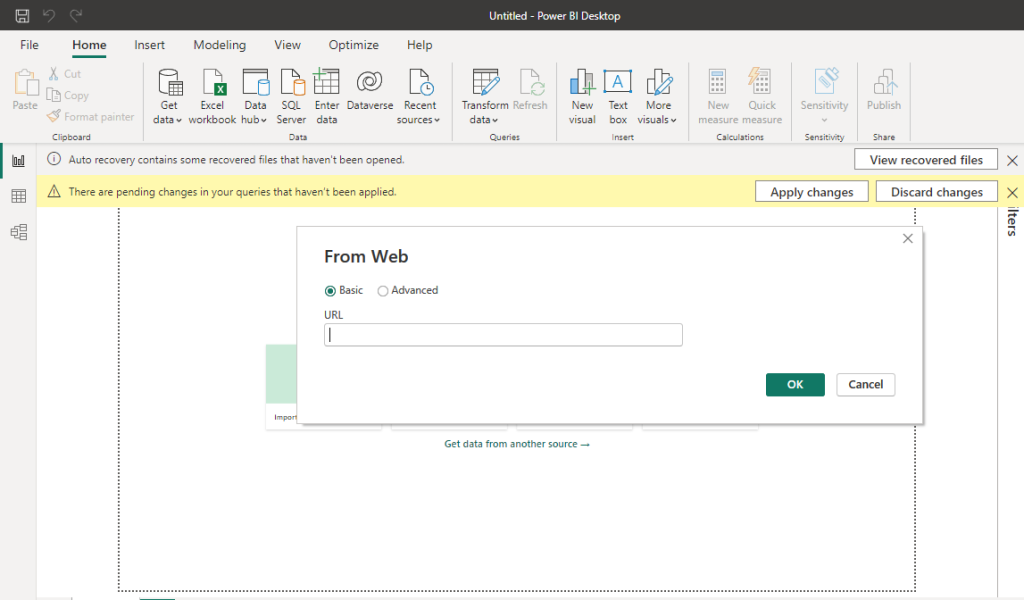
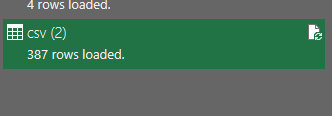
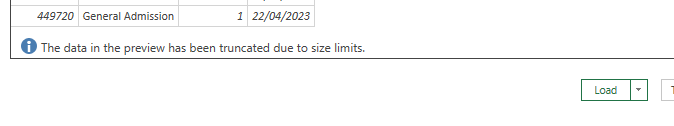
If a dialog with the data preview is shown, click on the Load button.
Once Power BI has imported your data, you can then generate the visualization reports that you want.
The URL that you copied will always generate current data.
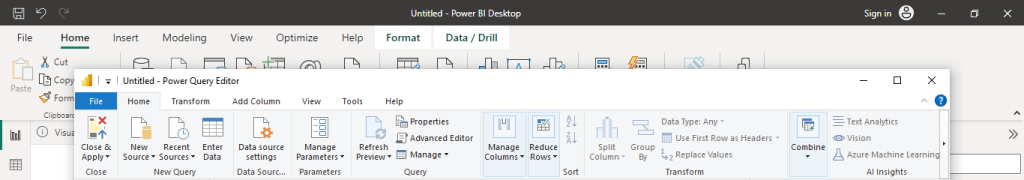
To refresh the imported data, in Power BI, in the Power Query Editor, click on the Refresh Preview.
Using Looker Studio
In the pop-up that then appears, click on the Copy For Google button.
Open a new Google Sheets spreadsheet, then give it a name.
After that, select cell A1 then go to the fx section, then paste the URL string that you copied then press ENTER on your keyboard.

After a few seconds, your data will be shown on the spreadsheet.
Once that’s done, log in to your Looker Studio account.
Click on the Blank Report template.
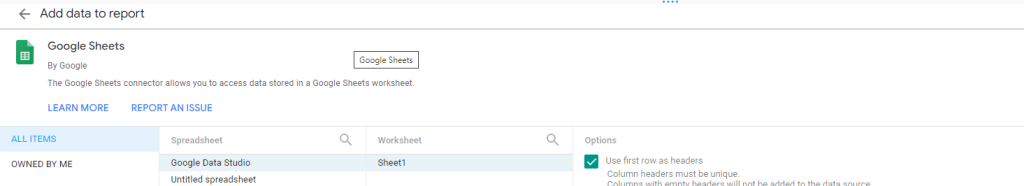
From the “Add data to report” prompt, select Google Sheets. Follow authentication steps if prompted for them.
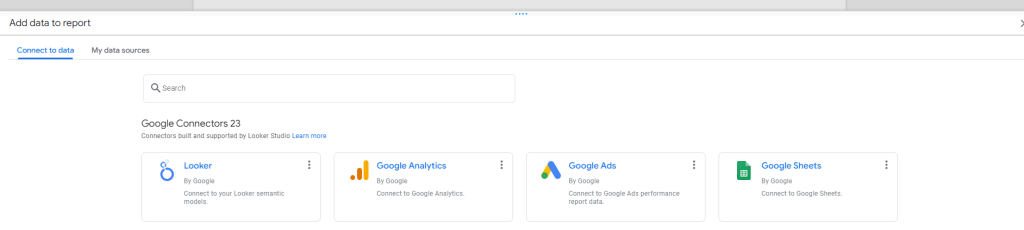
You will then be presented with a list of spreadsheets.
Select the one that you imported the data to.
Once Looker Studio has imported your data, you can then generate the visualization reports that you want.
The URL that you copied will always generate current data.
Google Sheets will continue refreshing the data on its own. Also, note, that Google Sheets does not allow imported data to be manually edited in the sheets.
Importing Data
You can import and view attendees’ data directly on Google Sheets or Excel. For example, when tickets get booked, their tickets get scanned, or offers are redeemed.
Various types of data are available. For example, they include purchases, check-ins, non-attendance, etc.
Importing attendee data on Google Sheets
To use the data feed link with Google Sheets, open a new Google Sheets spreadsheet, then give it a name.
After that, go to the fx section, then paste the URL string that you copied then press ENTER on your keyboard.
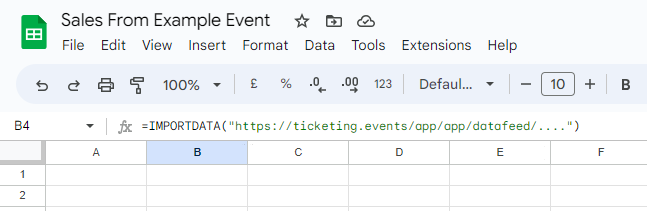
After a few seconds, your data will be shown on the spreadsheet.
Google Sheets will automatically refresh the data each time it detects a change.
Importing attendee data on Excel
In your Excel file, go to the Data tab then select From Web.
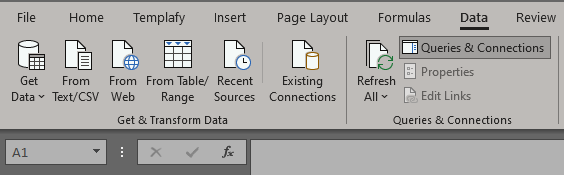
After that, paste the URL you copied for Excel, click OK, and follow any prompts shown.
In the dialog that appears, click on the Load button.
Your data will then get imported into a workbook.
To refresh the imported data, click on the refresh icon on the right-hand side pane.